
Map Data Art
Seismic activity and earthquakes in US mainland
Concept
Beyond Geological Risks
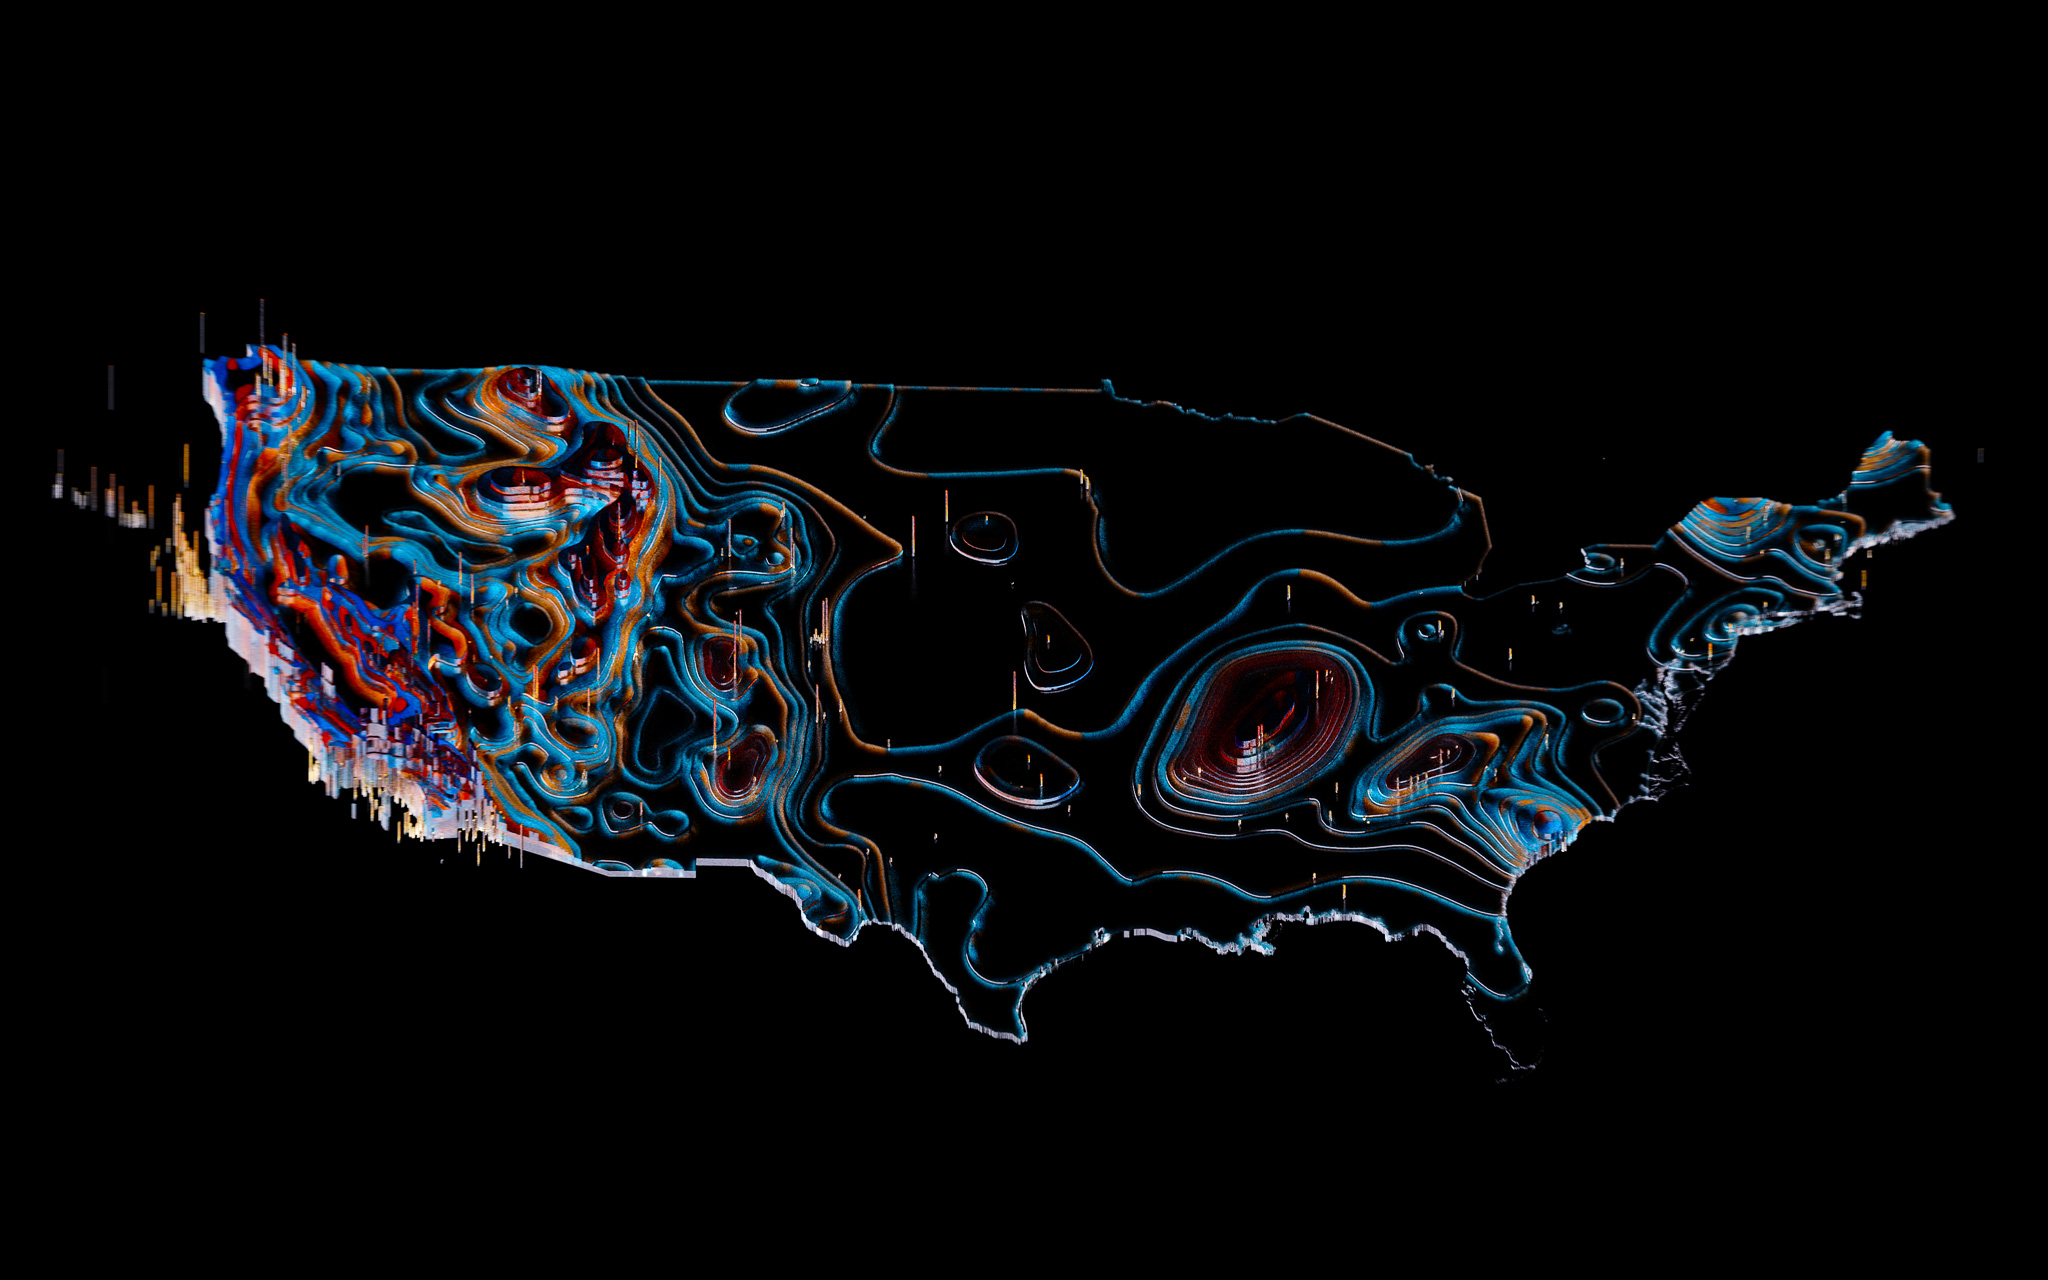
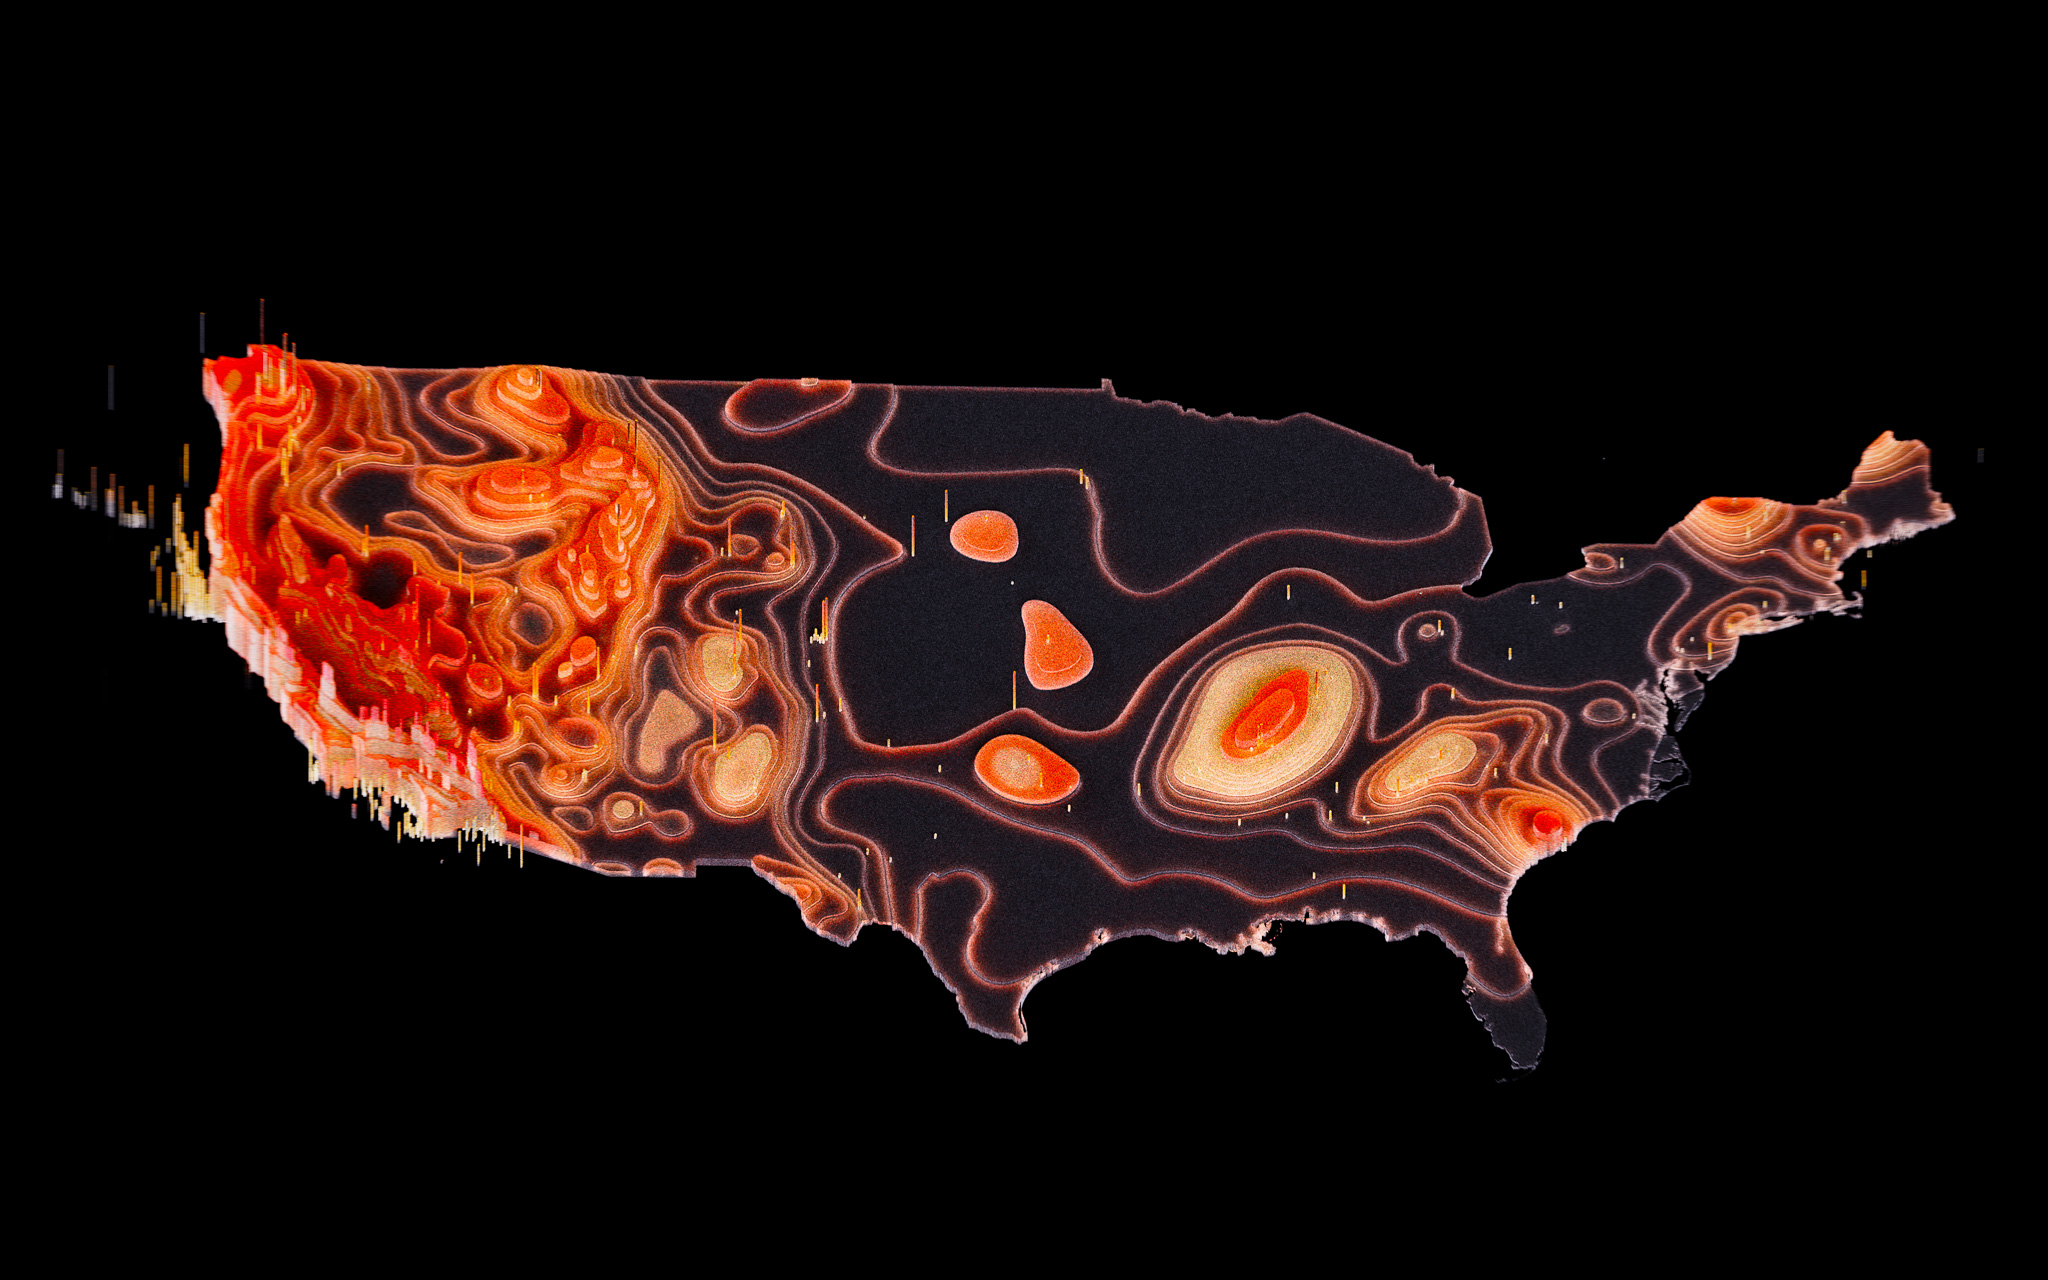
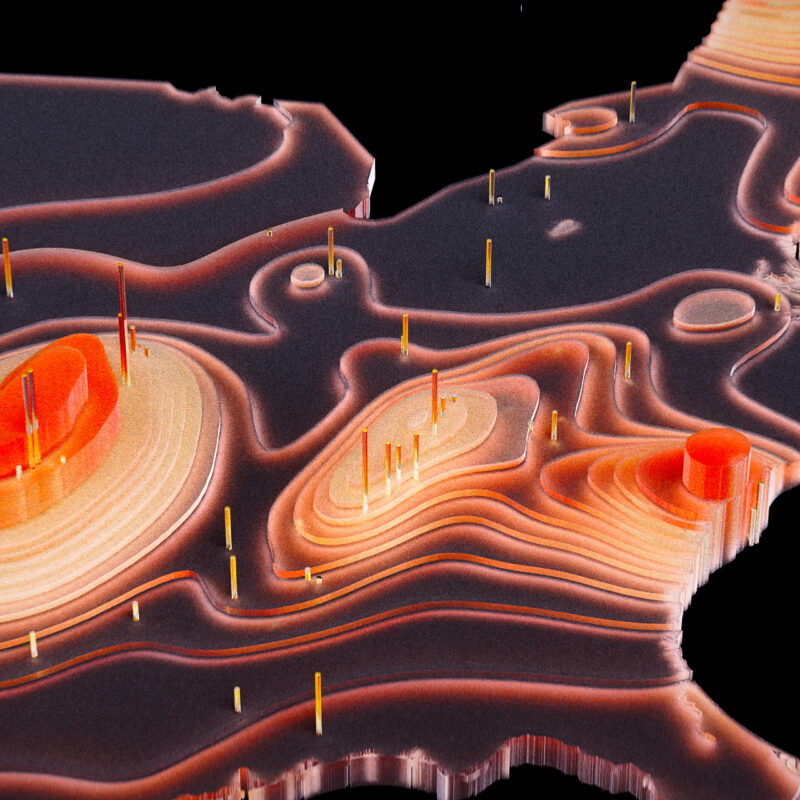
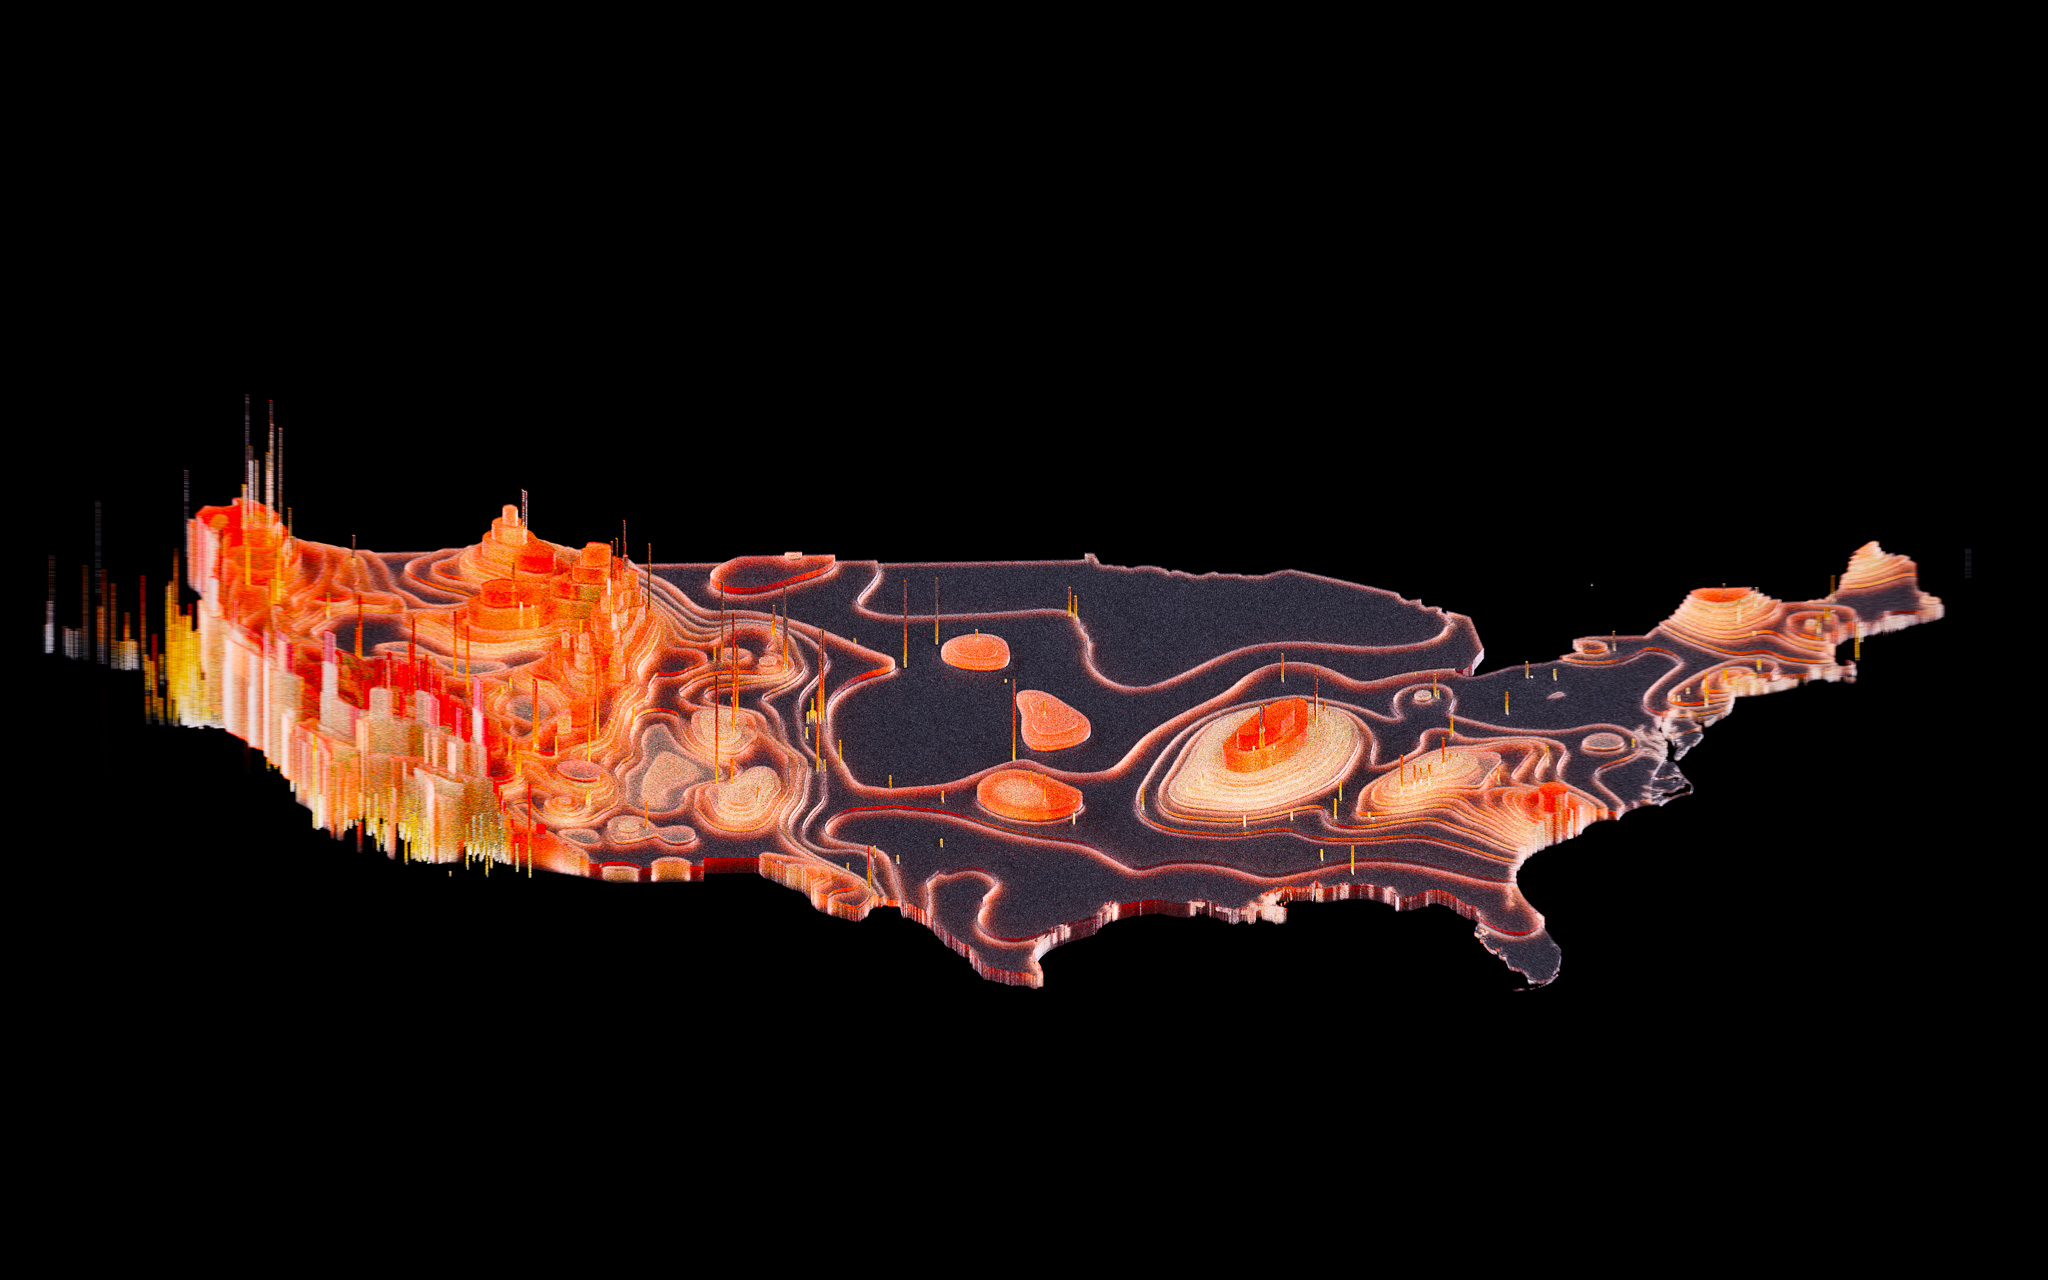
Visualizing the relationship between areas of high potential geological risk via seismic hazard zones and the incidence of earthquakes in the United States.
Earthquake hazard map showing peak ground accelerations having a 2 percent probability of being exceeded in 50 years, for a firm rock site. The map is based on the most recent USGS models for the conterminous U.S. (2018), Hawaii (1998), and Alaska (2007). The models are based on seismicity and fault-slip rates, and take into account the frequency of earthquakes of various magnitudes. Locally, the hazard may be greater than shown, because site geology may amplify ground motions.
Research
Base Data
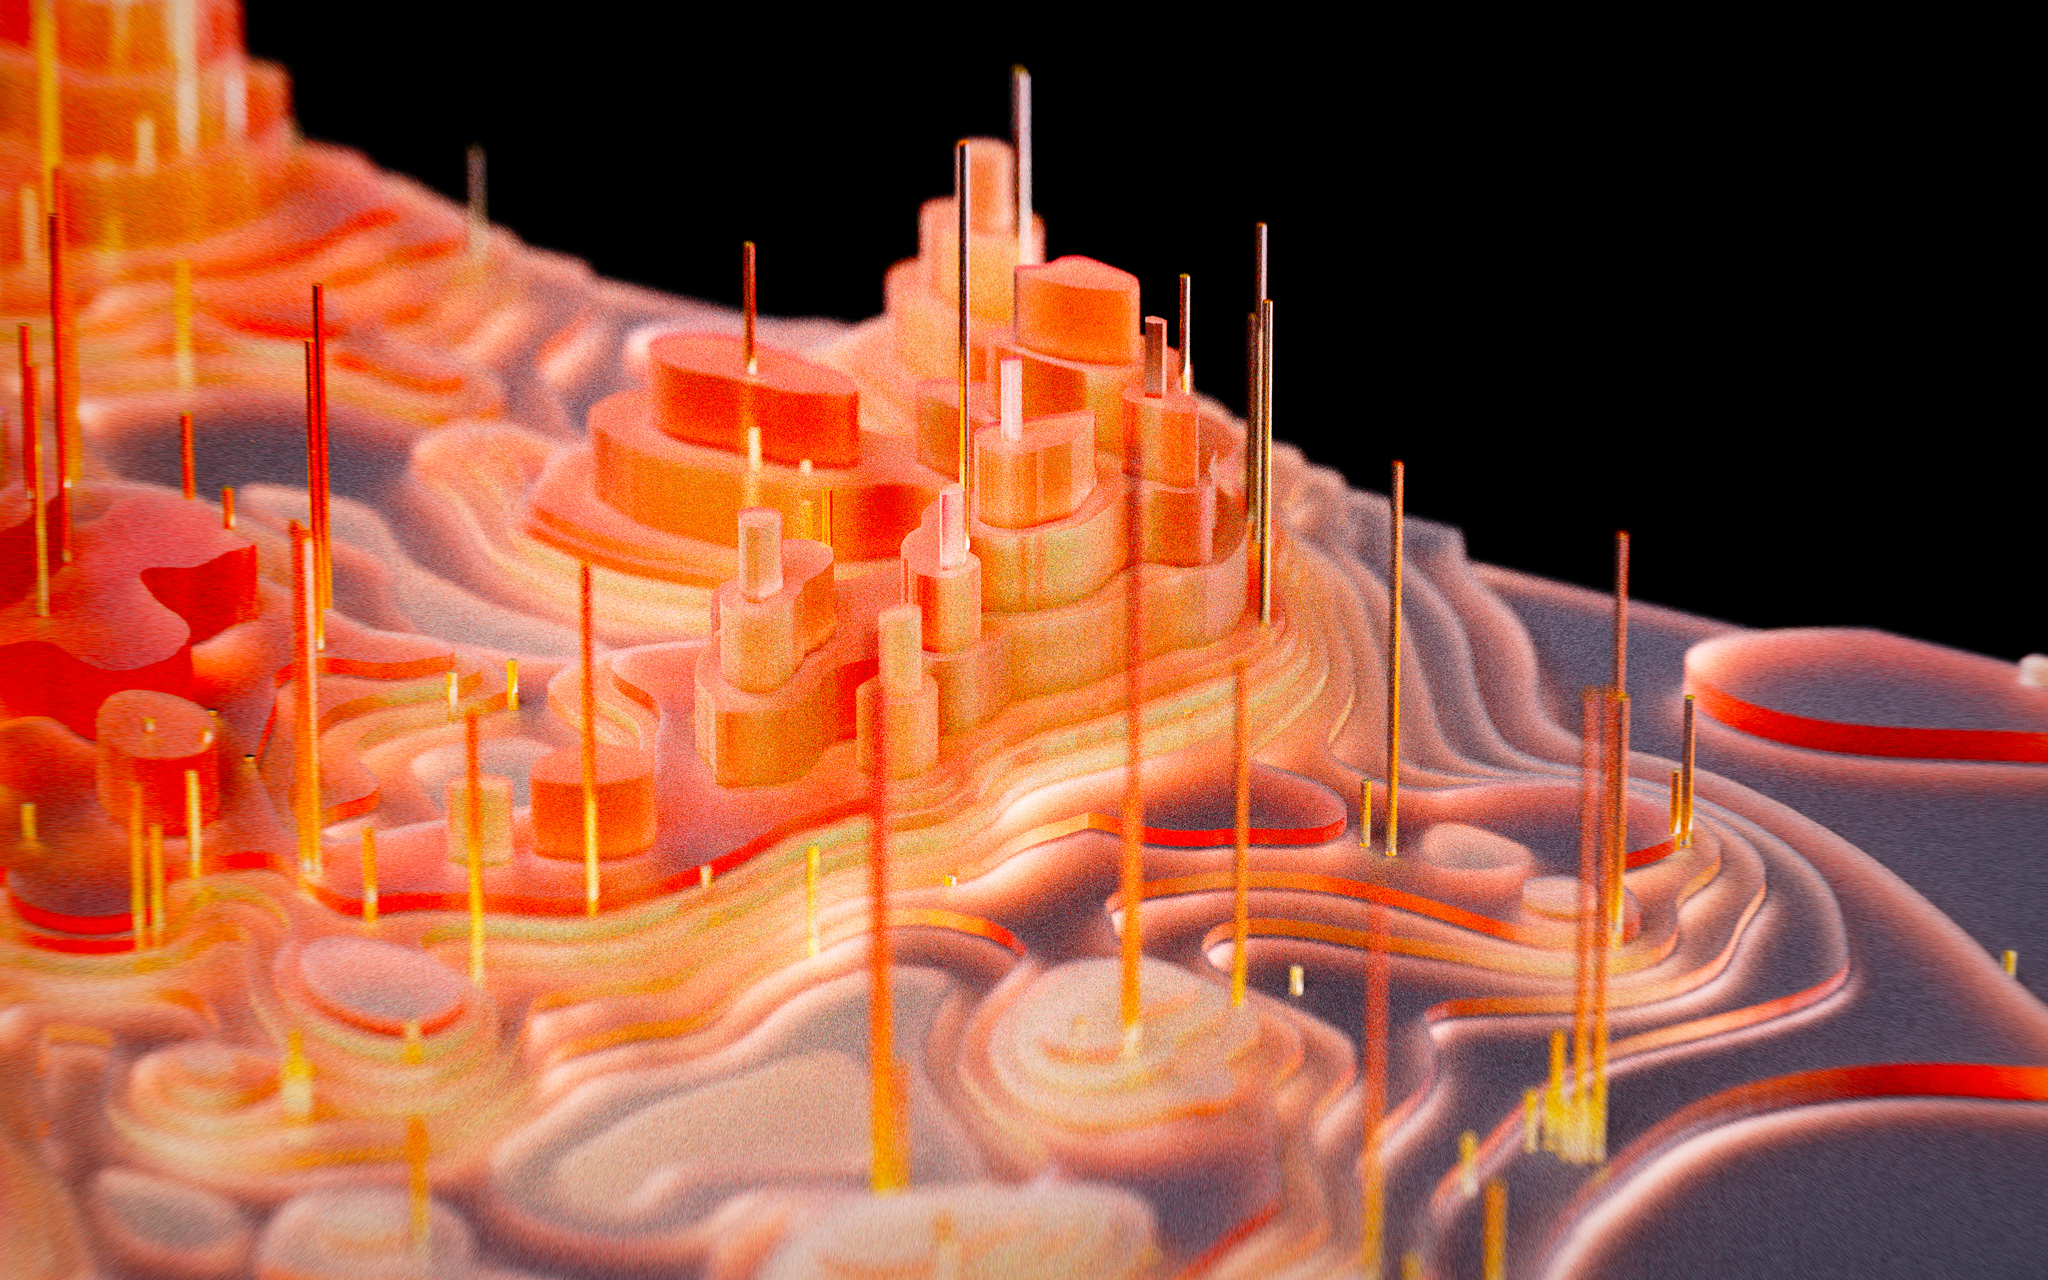
To simplify the map characteristics, US nuclear facilities were discarded from the original map, leaving only a clear representation of the potential magnitude impact of earthquakes in zones with high seismic activity.
Production
3D Modeling
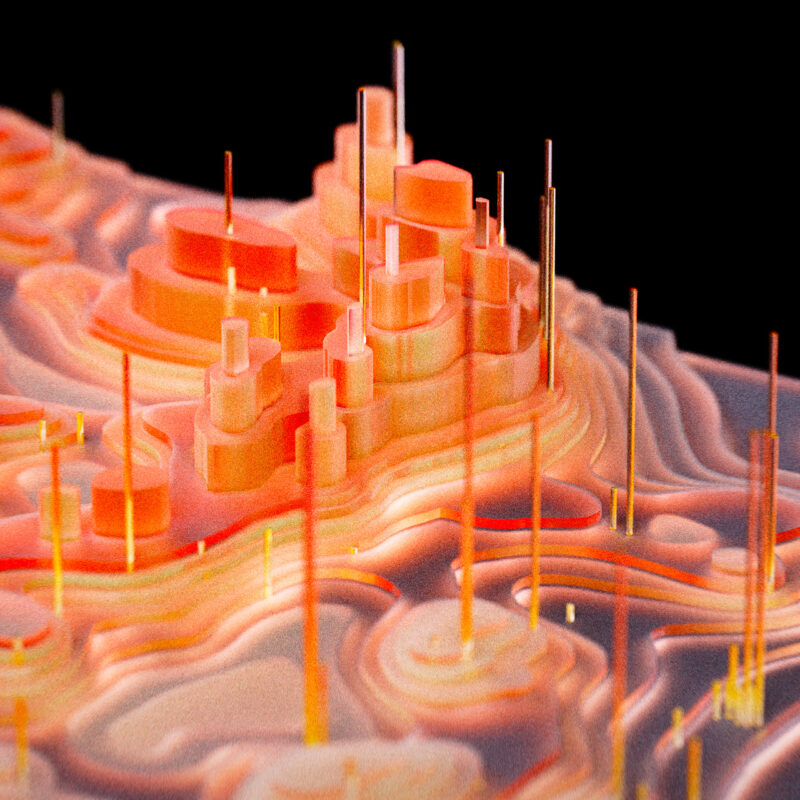
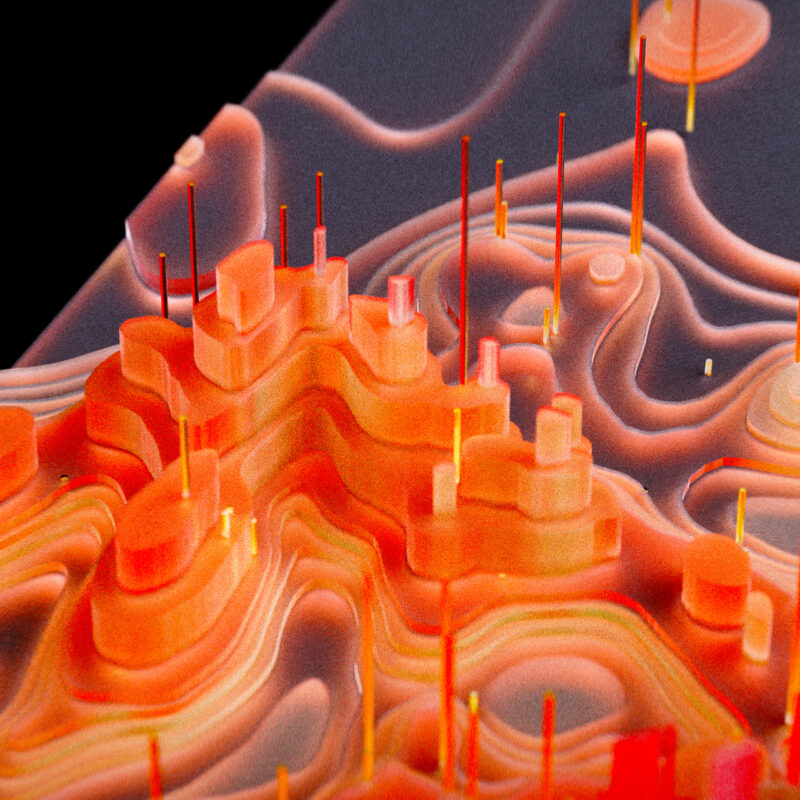
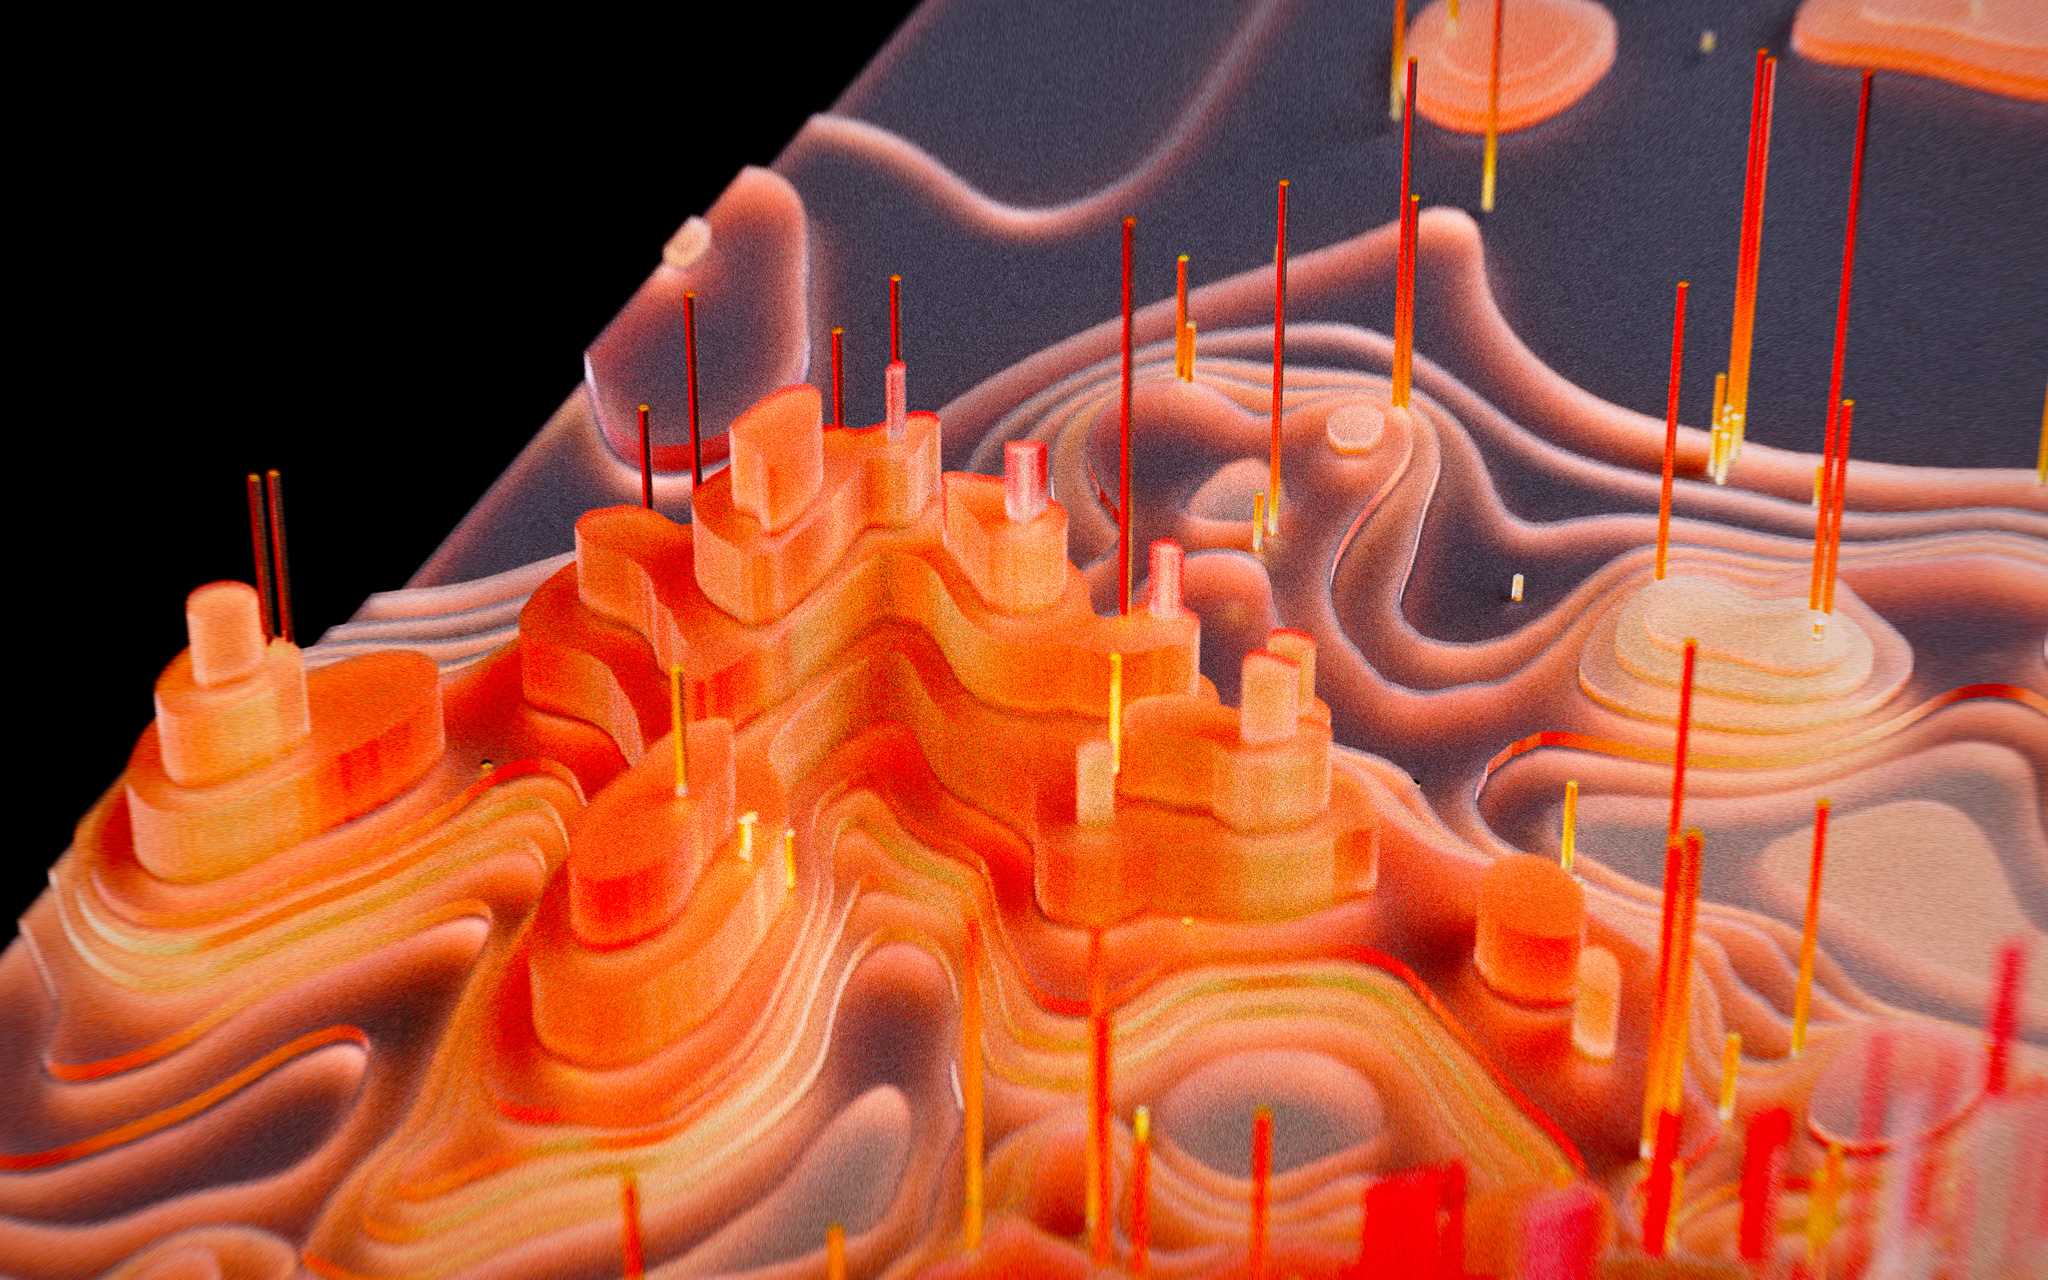
GIS data was downloaded in Shapefile format, which allowed the production of a spatial representation of the data. The file was then imported into Blender to produce layered geometry using Blender GIS.
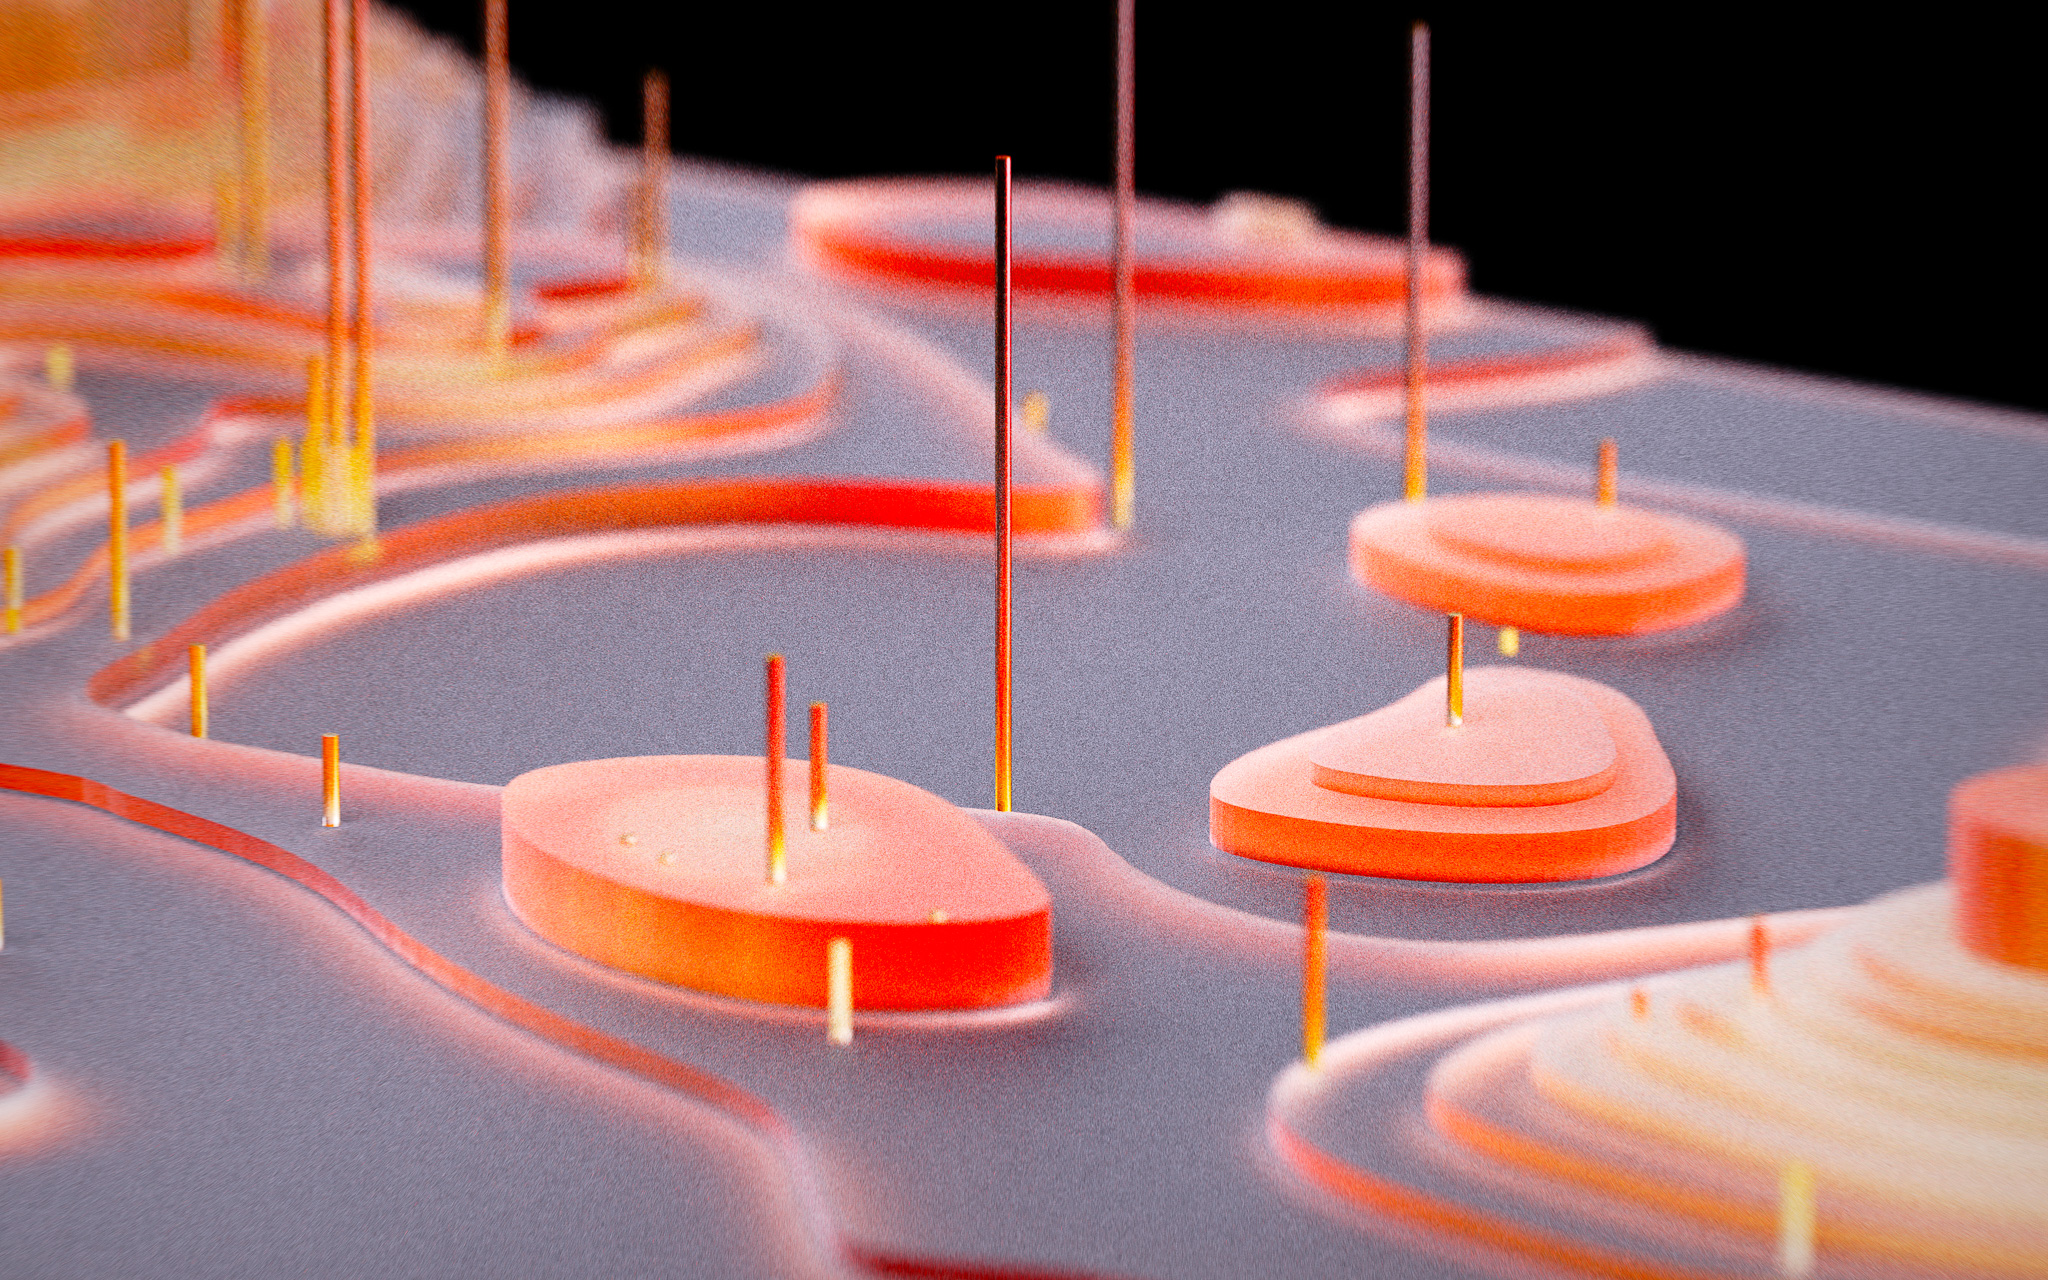
Data points were divided into 2 core layers: Topographic geometry and earthquake positions.
Product
Visualization
Model data was exported for rendering in Keyshot. A material exploration was implemented to evaluate the most efficient approach to rendering data without visual clutter.
• Occlusion Map
• Volume Study
Original look development rendered data as an elevation map. This result did not satisfy the initial intent of representing data as an energy release indicator.
Indicators
Activity
Footprint
15%
is “somewhat likely” to experience a damaging earthquake.
High Stakes
95%
Risk of strong seismic events for Hawaii and Alaska within the next 50 years.
Concept
Evaluating High Risk Areas
The findings shed light on the largest earthquake zones on Earth, such as the world’s greatest earthquake belt along the rim of the Pacific Ocean, dubbed the “Ring of Fire.”
When one considers very strong ground shaking levels, the 10 states with the highest populations exposed (in descending order) are California, Washington, Utah, Tennessee, Oregon, South Carolina, Nevada, Arkansas, Missouri and Illinois. Although this level of shaking is estimated to occur relatively infrequently, it could cause significant damage and causalities. The difference between those areas at risk from moderate versus strong shaking depends on a variety of factors, including the location of fault lines and the seismicity rates of the area.
Across the U.S. heartland, an oil and gas boom has driven a surge of small to moderate earthquakes.
Oil & Gas
Underground Injection
Wastewater
Gallery


Data-Portrait
Data-Portrait

Apex